34. Graph of Trigonometric Functions#
Graphs of functions give us idea about the nature of functions. As you must have drawn graphs of algebraic functions or linear equations similarly we draw the graph of trigonometric functions. One of the advantages of plotting graphs of trigonometric functions is that we can find values of artbitrary angles using the graph; while it is possible to calculate such values using the function definitions for algebraic functions it is much harder to do the same for trigionometric functions.
34.1. Problems#
Draw the graph of
Draw the graph of
Draw the graph of
Draw the graph of
Draw the graph of
Draw the graph of
Draw the graph of the function for
Draw the graph of the function .
Draw the graph of the function .
Draw the graph of .
Draw the graph of .
Draw the graph of .
Draw the graph of .
Draw the graph of .
Draw the graph of
Draw the graph of
Draw the graph of
Draw the graph of
Draw the graph of
Draw the graph of
Find the number of solutions of the equation for .
Find the number of roots of the equation lying between and .
Find the number of solutions of the equation .
Find the number of solutions of the equation .
Find the number of solutions of the equation .
Find the least positive value of satisfying the equation
Draw the graph of the function .
Draw the graph of the function .
Draw the graph of the function .
Draw the graph of the function .
Draw the graph of the function .
Find the solution of the equation using graph.
Find the solution of the equation using graph.
Find the solution of the equation using graph.
Find the solution of the equation using graph.
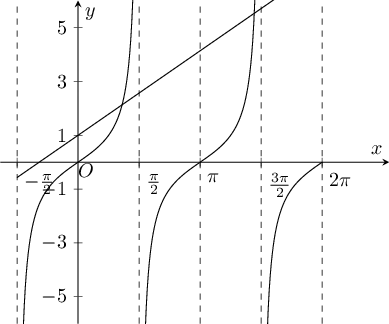
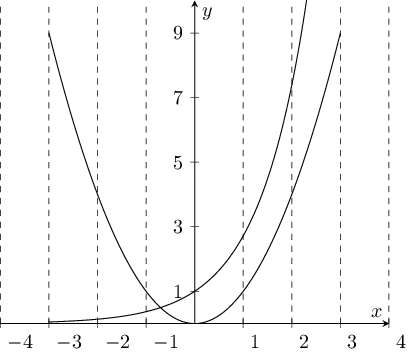
Draw the graph of and from to and determine the points of intersection of the two graphs.
Find the number of roots of the equation between and .
Shade the region enclosed by the curves and .
Shade the region enclosed by and .
34.2. Solutions#
First we create the table of values as given below (it is shown only for to , you need to add values for the entire range):
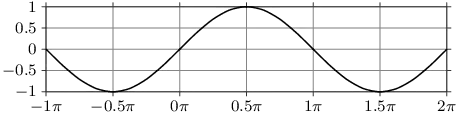
Then we plot the as shown below:
Like previous problem we create the table of values as given below (it is shown only for to , you need to add values for the entire range):
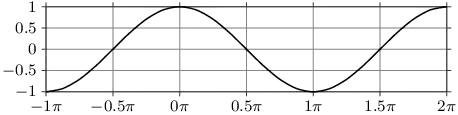
Then we plot the as shown below:
Like previous problem we create the table of values as given below (it is shown only for to , you need to add values for the entire range):
Then we plot the as shown below:
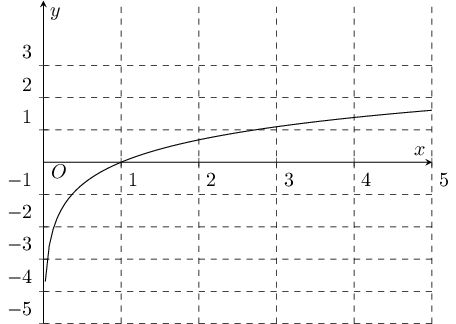
As we know that is inverse of we have following plot for :
As we know that is inverse of we have following plot for :
As we know that is inverse of we have following plot for :
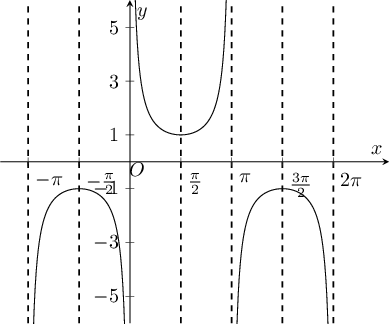
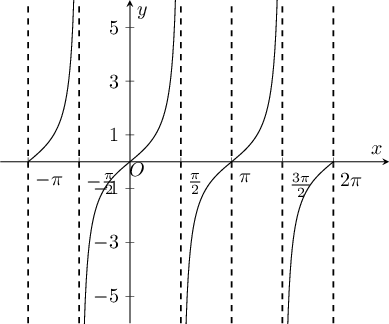
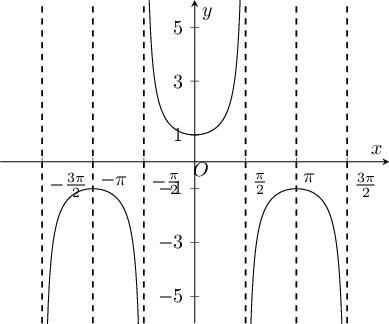
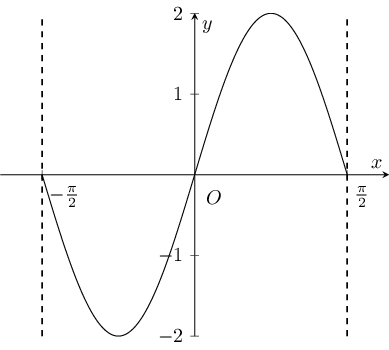
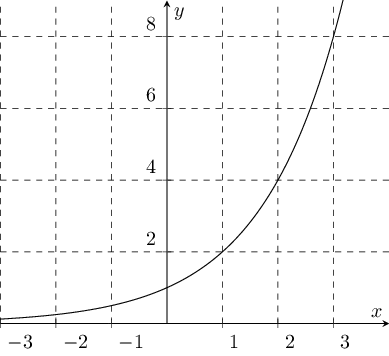
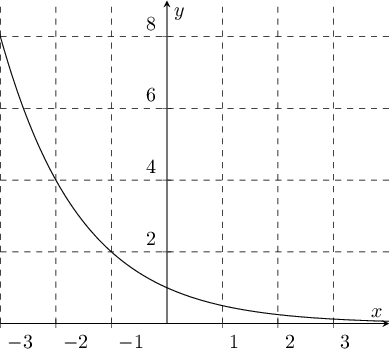
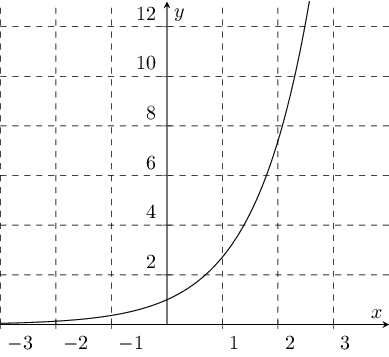
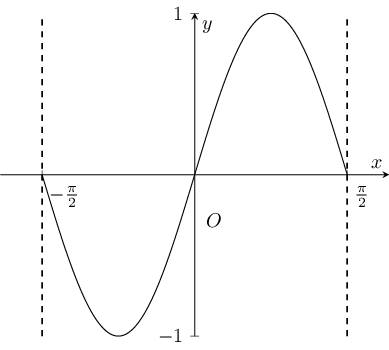
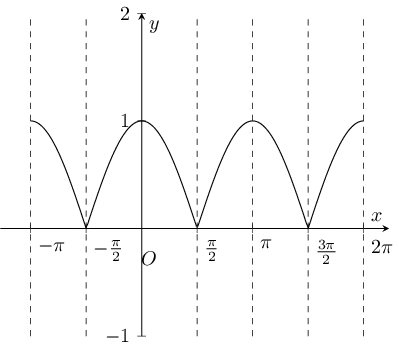
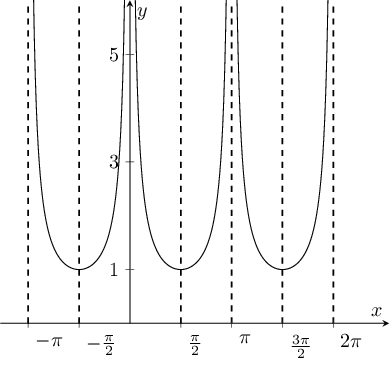
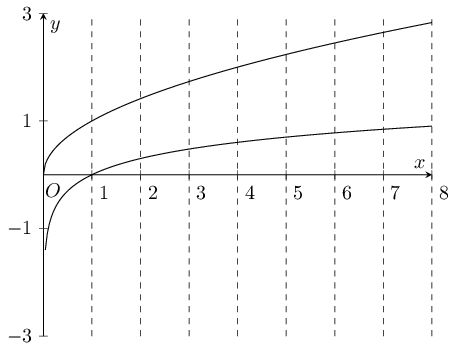
The plot of is given below:
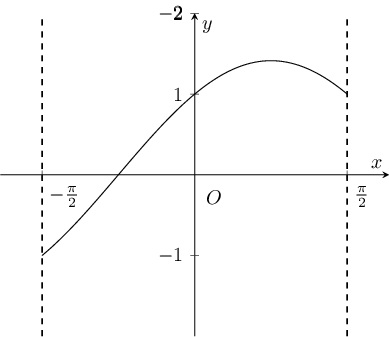
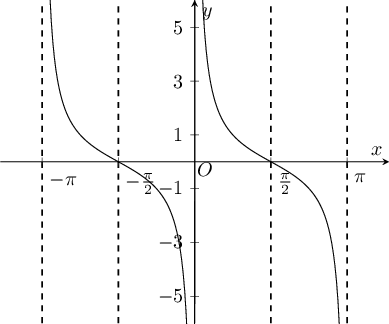
The plot of is given below:
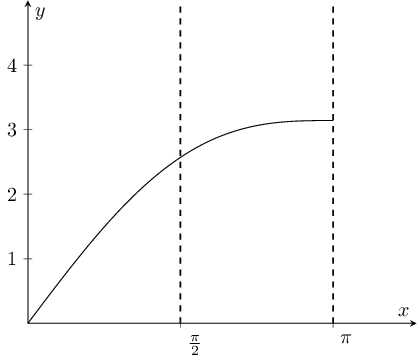
The plot of is given below:
will have two different plots. First plot is for and second plot is for .
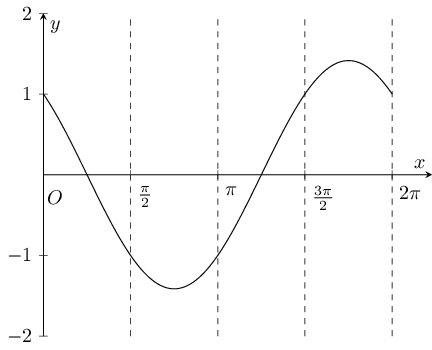
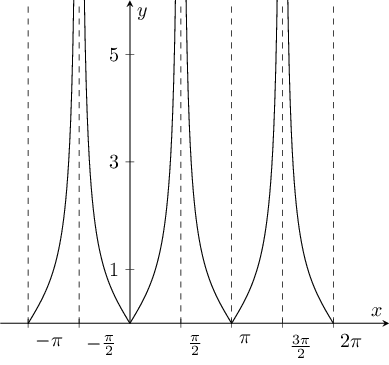
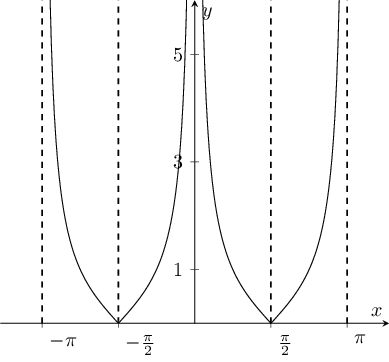
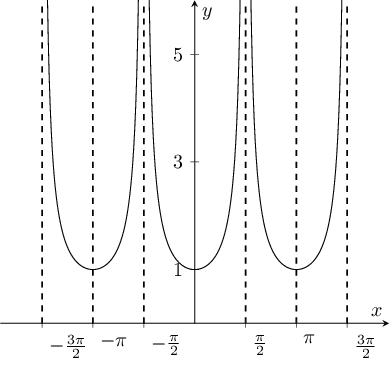
The plot of is given below:
The plot of is given below:
The plot of is given below:
The plot of is given below:
The plot of is given below:
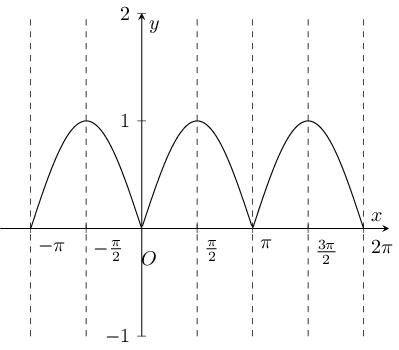
The plot of is given below:
The plot of is given below:
The plot of is given below:
The plot of is given below:
The plot of is given below:
We have to find number of solutions for for . So we plot both and and no. of intersections will be no. of solutions.
As we can see that there are two points of intersections so there will be two solutions of the given equation in the given range of .
Given equation is . So we plot for and in the range of .
As we can see that there are three points of intersections so there will be three solutions of the given equation in the given range of .
Given equation is . Let . When and when .
(approx.). Hence, the interval for will be between to .
By looking at figure we can deduce that total no. of solutions would be . of these will be for for and one solution for .
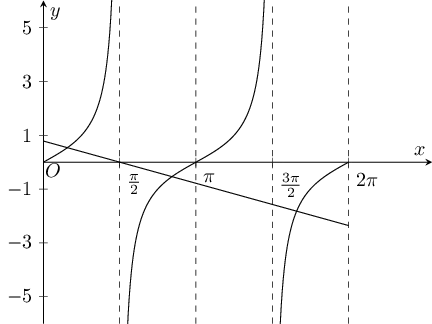
We have to find no. of solutions for so we plot and .
By looking at the graph it is clear that we will have only one solution for .
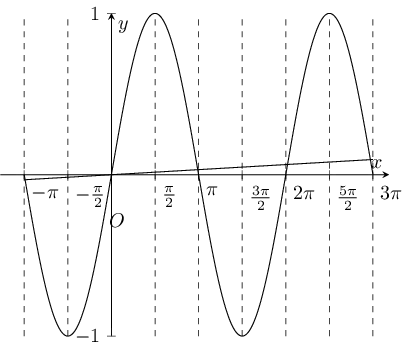
We have to find no. of solutions for so we plot and .
By looking at the graph it is clear that we will have no solution for .